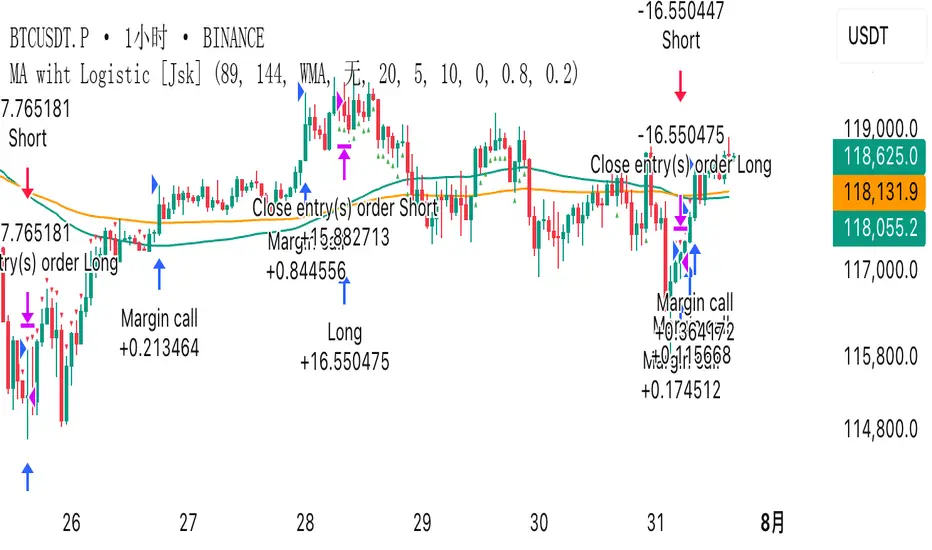
MA wiht Logistic [Jsk]This script is published for educational purposes only and does not constitute financial advice. Past performance does not guarantee future results. Trade at your own risk; the author accepts no liability for any financial loss incurred.
Concept
• Direction is defined by the relationship between price and two moving averages (Fast & Slow).
Long: Close > Fast MA > Slow MA
Short: Close < Fast MA < Slow MA
• Three independent exit modes are available:
1) None – positions are closed only when an opposite signal appears.
2) Percentage – fixed take-profit / stop-loss expressed in % of entry price (default +20 % / –5 %).
3) Logistic – a dynamic take-profit / stop-loss based on a logistic transformation of unrealised P&L.
Key Inputs
• MA Type: EMA, SMA or WMA
• Fast / Slow MA length
• Exit Mode: None | Percentage | Logistic
• Percentage TP / SL values (active when Exit Mode = Percentage)
• Logistic settings: slope k, midpoint, TP / SL probability thresholds (active when Exit Mode = Logistic)
Recommended Use
The script works on any market or timeframe, but MA-based trend filters usually perform better in assets with smooth, directional moves. Always verify results in the Strategy Tester and account for commissions and slippage.
Pesquisar nos scripts por "the script"
Combo 2/20 EMA & Bandpass Filter by TamarokDescription:
This strategy combines a 2/20 exponential moving average (EMA) crossover with a custom bandpass filter to generate buy and sell signals.
Use the Fast EMA and Slow EMA inputs to adjust trend sensitivity, and the Bandpass Filter Length, Delta, and Zones to fine-tune momentum turns.
Signals occur when both EMA and BPF agree in direction, with optional reversal and time filters.
How to use:
1. Add the script to your chart in TradingView.
2. Adjust the EMA and BP Filter parameters to match your asset’s volatility.
3. Enable ‘Reverse Signals’ to trade counter-trend, or use the time filter to limit sessions.
4. Set alerts on Long Alert and Short Alert for automated notifications.
Inspiration:
Based on HPotter’s original combo strategy (Stocks & Commodities Mar 2010).
Updated to Pine Script v6 with streamlined code and alerts.
WARNING:
For purpose educate only

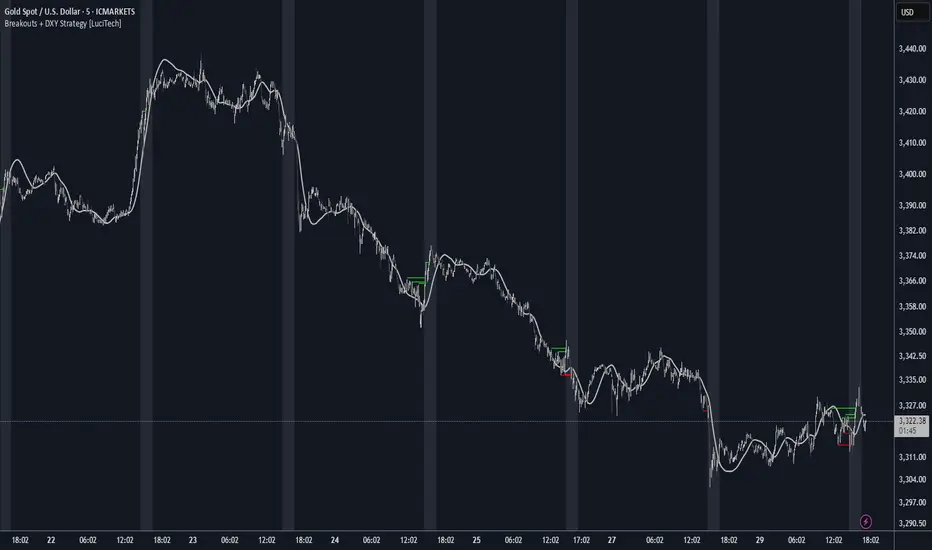
Breakouts With DXY Filter Strategy [LuciTech]This advanced breakout strategy combines pivot-based breakout detection with an innovative DXY (US Dollar Index) inverse correlation filter to enhance trade selection quality. The strategy identifies breakouts from recent pivot highs and lows while using DXY movements as a confirmation filter, based on the principle that USD strength/weakness often inversely correlates with other asset movements.
Key Features
Core Breakout Logic
- Pivot-Based Detection: Identifies breakouts above recent pivot highs (bullish) and below recent pivot lows (bearish)
- Customizable Lookback: Adjustable pivot length for different market conditions
- Visual Breakout Lines: Optional display of breakout levels with customizable colors
DXY Inverse Correlation Filter
- Smart USD Filter: Uses DXY movements to confirm breakout signals
- Inverse Logic: Long signals require DXY bearishness, short signals require DXY bullishness
- Threshold Control: Minimum DXY movement percentage required for signal confirmation
- Real-time DXY Data: Pulls live DXY data for accurate correlation analysis
Moving Average Filter
- Multiple MA Types: Support for SMA, EMA, WMA, VWMA, and HMA
- Trend Confirmation: Only takes trades in the direction of the selected moving average
- Customizable Parameters: Adjustable length and source for the moving average
Advanced Risk Management
- Multiple Stop Loss Types:
- ATR-based stops with customizable multiplier
- Candle-based stops using previous candle levels
- Fixed point-based stops
- Risk-Reward Optimization: Configurable risk-reward ratios (1:1 to 1:10)
- Breakeven Function: Automatic stop loss adjustment to breakeven after specified R-multiple
- Position Sizing: Percentage-based risk management with automatic position calculation
Time-Based Trading
- Session Filter: Trade only during specified time windows
- London Time Zone: Uses Europe/London timezone for consistency
- Visual Session Highlighting: Optional background fill for active trading hours
Alert System
- Webhook Integration: JSON-formatted alerts for automated trading
- Telegram Support: Pre-formatted messages for Telegram bot integration
- Multiple Formats: Standard, Telegram, and Concise Telegram alert options
- Real-time Notifications: Instant alerts on breakout signals
How It Works
1. Breakout Detection: The script continuously monitors for closes above recent pivot highs or below recent pivot lows
2. DXY Confirmation: When a breakout occurs, the script checks if DXY is moving in the opposite direction with sufficient momentum
3. MA Filter: If enabled, ensures the breakout aligns with the overall trend direction
4. Time Filter: Validates that the signal occurs within the specified trading hours
5. Risk Calculation: Automatically calculates position size based on the defined risk percentage and stop loss distance
6. Trade Execution: Places trades with predetermined stop loss and take profit levels
Unique Advantages
- Multi-Timeframe Approach: Combines asset-specific breakouts with broader USD market sentiment
- False Breakout Reduction: DXY filter helps eliminate breakouts that lack fundamental backing
- Comprehensive Risk Management: Multiple stop loss methods and automatic position sizing
- High Customization: Extensive parameters for different trading styles and market conditions
- Professional Alert System: Ready for automated trading integration
CVD Divergence + Volume HMA RSI MACD StrategyHow the script works:
The script calculates the HMA for trend direction. The HMA (shown in orange) is used as a filter: long trades are taken only if price is above the HMA, and short trades when below.
The CVD is computed by cumulatively adding volume on up bars and subtracting volume on down bars.
Pivot routines (with the input "Pivot Length") detect swing lows/highs for both price and CVD. A bullish divergence is flagged when the price makes a lower low while the CVD makes a higher low. Similarly, a bearish divergence is flagged when the price makes a higher high while the CVD makes a lower high.
Trading is triggered when the divergence condition also agrees with the HMA filter.
Feel free to further adjust the parameters or add risk‐management/exit rules as needed for your trading style.

Pullback Pro Dow Strategy v7 (ADX Filter)
### **Strategy Description (For TradingView)**
#### **Title:** Pullback Pro: Dow Theory & ADX Strategy
---
#### **1. Summary**
This strategy is designed to identify and trade pullbacks within an established trend, based on the core principles of Dow Theory. It uses market structure (pivot highs and lows) to determine the trend direction and an Exponential Moving Average (EMA) to pinpoint pullback entry opportunities.
To enhance trade quality and avoid ranging markets, an ADX (Average Directional Index) filter is integrated to ensure that entries are only taken when the trend has sufficient momentum.
---
#### **2. Core Logic: How It Works**
The strategy's logic is broken down into three main steps:
**Step 1: Trend Determination (Dow Theory)**
* The primary trend is identified by analyzing recent pivot points.
* An **Uptrend** is confirmed when the script detects a pattern of higher highs and higher lows (HH/HL).
* A **Downtrend** is confirmed by a pattern of lower highs and lower lows (LH/LL).
* If neither pattern is present, the strategy considers the market to be in a range and will not seek trades.
**Step 2: Entry Signal (Pullback to EMA)**
* Once a clear trend is established, the strategy waits for a price correction.
* **Long Entry:** In a confirmed uptrend, a long position is initiated when the price pulls back and crosses *under* the specified EMA.
* **Short Entry:** In a confirmed downtrend, a short position is initiated when the price rallies and crosses *over* the EMA.
**Step 3: Confirmation & Risk Management**
* **ADX Filter:** To ensure the trend is strong enough to trade, an entry signal is only validated if the ADX value is above a user-defined threshold (e.g., 25). This helps filter out weak signals during choppy or consolidating markets.
* **Stop Loss:** The initial Stop Loss is automatically and logically placed at the last market structure point:
* For long trades, it's placed at the `lastPivotLow`.
* For short trades, it's placed at the `lastPivotHigh`.
* **Take Profit:** Two Take Profit levels are calculated based on user-defined Risk-to-Reward (R:R) ratios. The strategy allows for partial profit-taking at the first target (TP1), moving the remainder of the position to the second target (TP2).
---
#### **3. Input Settings Explained**
**① Dow Theory Settings**
* **Pivot Lookback Period:** Determines the sensitivity for detecting pivot highs and lows. A smaller number makes it more sensitive to recent price swings; a larger number focuses on more significant, longer-term pivots.
**② Entry Logic (Pullback)**
* **Pullback EMA Length:** Sets the period for the Exponential Moving Average used to identify pullback entries.
**③ Risk & Exit Management**
* **Take Profit 1 R:R:** Sets the Risk-to-Reward ratio for the first take-profit target.
* **Take Profit 1 (%):** The percentage of the position to be closed when TP1 is hit.
* **Take Profit 2 R:R:** Sets the Risk-to-Reward ratio for the final take-profit target.
**④ Filters**
* **Use ADX Trend Filter:** A master switch to enable or disable the ADX filter.
* **ADX Length:** The lookback period for the ADX calculation.
* **ADX Threshold:** The minimum ADX value required to confirm a trade signal. Trades will only be placed if the ADX is above this level.
---
#### **4. Best Practices & Recommendations**
* This is a trend-following system. It is designed to perform best in markets that exhibit clear, sustained trending behavior.
* It may underperform in choppy, sideways, or strongly ranging markets. The ADX filter is designed to help mitigate this, but no filter is perfect.
* **Crucially, you must backtest this strategy thoroughly** on your preferred financial instrument and timeframe before considering any live application.
* Experiment with the `Pivot Lookback Period`, `Pullback EMA Length`, and `ADX Threshold` to optimize performance for a specific market's characteristics.
---
#### **DISCLAIMER**
This script is provided for educational and informational purposes only. It does not constitute financial advice. All trading involves a high level of risk, and past performance is not indicative of future results. You are solely responsible for your own trading decisions. The author assumes no liability for any financial losses you may incur from using this strategy. Always conduct your own research and due diligence.

VoVix DEVMA🌌 VoVix DEVMA: A Deep Dive into Second-Order Volatility Dynamics
Welcome to VoVix+, a sophisticated trading framework that transcends traditional price analysis. This is not merely another indicator; it is a complete system designed to dissect and interpret the very fabric of market volatility. VoVix+ operates on the principle that the most powerful signals are not found in price alone, but in the behavior of volatility itself. It analyzes the rate of change, the momentum, and the structure of market volatility to identify periods of expansion and contraction, providing a unique edge in anticipating major market moves.
This document will serve as your comprehensive guide, breaking down every mathematical component, every user input, and every visual element to empower you with a profound understanding of how to harness its capabilities.
🔬 THEORETICAL FOUNDATION: THE MATHEMATICS OF MARKET DYNAMICS
VoVix+ is built upon a multi-layered mathematical engine designed to measure what we call "second-order volatility." While standard indicators analyze price, and first-order volatility indicators (like ATR) analyze the range of price, VoVix+ analyzes the dynamics of the volatility itself. This provides insight into the market's underlying state of stability or chaos.
1. The VoVix Score: Measuring Volatility Thrust
The core of the system begins with the VoVix Score. This is a normalized measure of volatility acceleration or deceleration.
Mathematical Formula:
VoVix Score = (ATR(fast) - ATR(slow)) / (StDev(ATR(fast)) + ε)
Where:
ATR(fast) is the Average True Range over a short period, representing current, immediate volatility.
ATR(slow) is the Average True Range over a longer period, representing the baseline or established volatility.
StDev(ATR(fast)) is the Standard Deviation of the fast ATR, which measures the "noisiness" or consistency of recent volatility.
ε (epsilon) is a very small number to prevent division by zero.
Market Implementation:
Positive Score (Expansion): When the fast ATR is significantly higher than the slow ATR, it indicates a rapid increase in volatility. The market is "stretching" or expanding.
Negative Score (Contraction): When the fast ATR falls below the slow ATR, it indicates a decrease in volatility. The market is "coiling" or contracting.
Normalization: By dividing by the standard deviation, we normalize the score. This turns it into a standardized measure, allowing us to compare volatility thrust across different market conditions and timeframes. A score of 2.0 in a quiet market means the same, relatively, as a score of 2.0 in a volatile market.
2. Deviation Analysis (DEV): Gauging Volatility's Own Volatility
The script then takes the analysis a step further. It calculates the standard deviation of the VoVix Score itself.
Mathematical Formula:
DEV = StDev(VoVix Score, lookback_period)
Market Implementation:
This DEV value represents the magnitude of chaos or stability in the market's volatility dynamics. A high DEV value means the volatility thrust is erratic and unpredictable. A low DEV value suggests the change in volatility is smooth and directional.
3. The DEVMA Crossover: Identifying Regime Shifts
This is the primary signal generator. We take two moving averages of the DEV value.
Mathematical Formula:
fastDEVMA = SMA(DEV, fast_period)
slowDEVMA = SMA(DEV, slow_period)
The Core Signal:
The strategy triggers on the crossover and crossunder of these two DEVMA lines. This is a profound concept: we are not looking at a moving average of price or even of volatility, but a moving average of the standard deviation of the normalized rate of change of volatility.
Bullish Crossover (fastDEVMA > slowDEVMA): This signals that the short-term measure of volatility's chaos is increasing relative to the long-term measure. This often precedes a significant market expansion and is interpreted as a bullish volatility regime.
Bearish Crossunder (fastDEVMA < slowDEVMA): This signals that the short-term measure of volatility's chaos is decreasing. The market is settling down or contracting, often leading to trending moves or range consolidation.
⚙️ INPUTS MENU: CONFIGURING YOUR ANALYSIS ENGINE
Every input has been meticulously designed to give you full control over the strategy's behavior. Understanding these settings is key to adapting VoVix+ to your specific instrument, timeframe, and trading style.
🌀 VoVix DEVMA Configuration
🧬 Deviation Lookback: This sets the lookback period for calculating the DEV value. It defines the window for measuring the stability of the VoVix Score. A shorter value makes the system highly reactive to recent changes in volatility's character, ideal for scalping. A longer value provides a smoother, more stable reading, better for identifying major, long-term regime shifts.
⚡ Fast VoVix Length: This is the lookback period for the fastDEVMA. It represents the short-term trend of volatility's chaos. A smaller number will result in a faster, more sensitive signal line that reacts quickly to market shifts.
🐌 Slow VoVix Length: This is the lookback period for the slowDEVMA. It represents the long-term, baseline trend of volatility's chaos. A larger number creates a more stable, slower-moving anchor against which the fast line is compared.
How to Optimize: The relationship between the Fast and Slow lengths is crucial. A wider gap (e.g., 20 and 60) will result in fewer, but potentially more significant, signals. A narrower gap (e.g., 25 and 40) will generate more frequent signals, suitable for more active trading styles.
🧠 Adaptive Intelligence
🧠 Enable Adaptive Features: When enabled, this activates the strategy's performance tracking module. The script will analyze the outcome of its last 50 trades to calculate a dynamic win rate.
⏰ Adaptive Time-Based Exit: If Enable Adaptive Features is on, this allows the strategy to adjust its Maximum Bars in Trade setting based on performance. It learns from the average duration of winning trades. If winning trades tend to be short, it may shorten the time exit to lock in profits. If winners tend to run, it will extend the time exit, allowing trades more room to develop. This helps prevent the strategy from cutting winning trades short or holding losing trades for too long.
⚡ Intelligent Execution
📊 Trade Quantity: A straightforward input that defines the number of contracts or shares for each trade. This is a fixed value for consistent position sizing.
🛡️ Smart Stop Loss: Enables the dynamic stop-loss mechanism.
🎯 Stop Loss ATR Multiplier: Determines the distance of the stop loss from the entry price, calculated as a multiple of the current 14-period ATR. A higher multiplier gives the trade more room to breathe but increases risk per trade. A lower multiplier creates a tighter stop, reducing risk but increasing the chance of being stopped out by normal market noise.
💰 Take Profit ATR Multiplier: Sets the take profit target, also as a multiple of the ATR. A common practice is to set this higher than the Stop Loss multiplier (e.g., a 2:1 or 3:1 reward-to-risk ratio).
🏃 Use Trailing Stop: This is a powerful feature for trend-following. When enabled, instead of a fixed stop loss, the stop will trail behind the price as the trade moves into profit, helping to lock in gains while letting winners run.
🎯 Trail Points & 📏 Trail Offset ATR Multipliers: These control the trailing stop's behavior. Trail Points defines how much profit is needed before the trail activates. Trail Offset defines how far the stop will trail behind the current price. Both are based on ATR, making them fully adaptive to market volatility.
⏰ Maximum Bars in Trade: This is a time-based stop. It forces an exit if a trade has been open for a specified number of bars, preventing positions from being held indefinitely in stagnant markets.
⏰ Session Management
These inputs allow you to confine the strategy's trading activity to specific market hours, which is crucial for day trading instruments that have defined high-volume sessions (e.g., stock market open).
🎨 Visual Effects & Dashboard
These toggles give you complete control over the on-chart visuals and the dashboard. You can disable any element to declutter your chart or focus only on the information that matters most to you.
📊 THE DASHBOARD: YOUR AT-A-GLANCE COMMAND CENTER
The dashboard centralizes all critical information into one compact, easy-to-read panel. It provides a real-time summary of the market state and strategy performance.
🎯 VOVIX ANALYSIS
Fast & Slow: Displays the current numerical values of the fastDEVMA and slowDEVMA. The color indicates their direction: green for rising, red for falling. This lets you see the underlying momentum of each line.
Regime: This is your most important environmental cue. It tells you the market's current state based on the DEVMA relationship. 🚀 EXPANSION (Green) signifies a bullish volatility regime where explosive moves are more likely. ⚛️ CONTRACTION (Purple) signifies a bearish volatility regime, where the market may be consolidating or entering a smoother trend.
Quality: Measures the strength of the last signal based on the magnitude of the DEVMA difference. An ELITE or STRONG signal indicates a high-conviction setup where the crossover had significant force.
PERFORMANCE
Win Rate & Trades: Displays the historical win rate of the strategy from the backtest, along with the total number of closed trades. This provides immediate feedback on the strategy's historical effectiveness on the current chart.
EXECUTION
Trade Qty: Shows your configured position size per trade.
Session: Indicates whether trading is currently OPEN (allowed) or CLOSED based on your session management settings.
POSITION
Position & PnL: Displays your current position (LONG, SHORT, or FLAT) and the real-time Profit or Loss of the open trade.
🧠 ADAPTIVE STATUS
Stop/Profit Mult: In this simplified version, these are placeholders. The primary adaptive feature currently modifies the time-based exit, which is reflected in how long trades are held on the chart.
🎨 THE VISUAL UNIVERSE: DECIPHERING MARKET GEOMETRY
The visuals are not mere decorations; they are geometric representations of the underlying mathematical concepts, designed to give you an intuitive feel for the market's state.
The Core Lines:
FastDEVMA (Green/Maroon Line): The primary signal line. Green when rising, indicating an increase in short-term volatility chaos. Maroon when falling.
SlowDEVMA (Aqua/Orange Line): The baseline. Aqua when rising, indicating a long-term increase in volatility chaos. Orange when falling.
🌊 Morphism Flow (Flowing Lines with Circles):
What it represents: This visualizes the momentum and strength of the fastDEVMA. The width and intensity of the "beam" are proportional to the signal strength.
Interpretation: A thick, steep, and vibrant flow indicates powerful, committed momentum in the current volatility regime. The floating '●' particles represent kinetic energy; more particles suggest stronger underlying force.
📐 Homotopy Paths (Layered Transparent Boxes):
What it represents: These layered boxes are centered between the two DEVMA lines. Their height is determined by the DEV value.
Interpretation: This visualizes the overall "volatility of volatility." Wider boxes indicate a chaotic, unpredictable market. Narrower boxes suggest a more stable, predictable environment.
🧠 Consciousness Field (The Grid):
What it represents: This grid provides a historical lookback at the DEV range.
Interpretation: It maps the recent "consciousness" or character of the market's volatility. A consistently wide grid suggests a prolonged period of chaos, while a narrowing grid can signal a transition to a more stable state.
📏 Functorial Levels (Projected Horizontal Lines):
What it represents: These lines extend from the current fastDEVMA and slowDEVMA values into the future.
Interpretation: Think of these as dynamic support and resistance levels for the volatility structure itself. A crossover becomes more significant if it breaks cleanly through a prior established level.
🌊 Flow Boxes (Spaced Out Boxes):
What it represents: These are compact visual footprints of the current regime, colored green for Expansion and red for Contraction.
Interpretation: They provide a quick, at-a-glance confirmation of the dominant volatility flow, reinforcing the background color.
Background Color:
This provides an immediate, unmistakable indication of the current volatility regime. Light Green for Expansion and Light Aqua/Blue for Contraction, allowing you to assess the market environment in a split second.
📊 BACKTESTING PERFORMANCE REVIEW & ANALYSIS
The following is a factual, transparent review of a backtest conducted using the strategy's default settings on a specific instrument and timeframe. This information is presented for educational purposes to demonstrate how the strategy's mechanics performed over a historical period. It is crucial to understand that these results are historical, apply only to the specific conditions of this test, and are not a guarantee or promise of future performance. Market conditions are dynamic and constantly change.
Test Parameters & Conditions
To ensure the backtest reflects a degree of real-world conditions, the following parameters were used. The goal is to provide a transparent baseline, not an over-optimized or unrealistic scenario.
Instrument: CME E-mini Nasdaq 100 Futures (NQ1!)
Timeframe: 5-Minute Chart
Backtesting Range: March 24, 2024, to July 09, 2024
Initial Capital: $100,000
Commission: $0.62 per contract (A realistic cost for futures trading).
Slippage: 3 ticks per trade (A conservative setting to account for potential price discrepancies between order placement and execution).
Trade Size: 1 contract per trade.
Performance Overview (Historical Data)
The test period generated 465 total trades , providing a statistically significant sample size for analysis, which is well above the recommended minimum of 100 trades for a strategy evaluation.
Profit Factor: The historical Profit Factor was 2.663 . This metric represents the gross profit divided by the gross loss. In this test, it indicates that for every dollar lost, $2.663 was gained.
Percent Profitable: Across all 465 trades, the strategy had a historical win rate of 84.09% . While a high figure, this is a historical artifact of this specific data set and settings, and should not be the sole basis for future expectations.
Risk & Trade Characteristics
Beyond the headline numbers, the following metrics provide deeper insight into the strategy's historical behavior.
Sortino Ratio (Downside Risk): The Sortino Ratio was 6.828 . Unlike the Sharpe Ratio, this metric only measures the volatility of negative returns. A higher value, such as this one, suggests that during this test period, the strategy was highly efficient at managing downside volatility and large losing trades relative to the profits it generated.
Average Trade Duration: A critical characteristic to understand is the strategy's holding period. With an average of only 2 bars per trade , this configuration operates as a very short-term, or scalping-style, system. Winning trades averaged 2 bars, while losing trades averaged 4 bars. This indicates the strategy's logic is designed to capture quick, high-probability moves and exit rapidly, either at a profit target or a stop loss.
Conclusion and Final Disclaimer
This backtest demonstrates one specific application of the VoVix+ framework. It highlights the strategy's behavior as a short-term system that, in this historical test on NQ1!, exhibited a high win rate and effective management of downside risk. Users are strongly encouraged to conduct their own backtests on different instruments, timeframes, and date ranges to understand how the strategy adapts to varying market structures. Past performance is not indicative of future results, and all trading involves significant risk.
🔧 THE DEVELOPMENT PHILOSOPHY: FROM VOLATILITY TO CLARITY
The journey to create VoVix+ began with a simple question: "What drives major market moves?" The answer is often not a change in price direction, but a fundamental shift in market volatility. Standard indicators are reactive to price. We wanted to create a system that was predictive of market state. VoVix+ was designed to go one level deeper—to analyze the behavior, character, and momentum of volatility itself.
The challenge was twofold. First, to create a robust mathematical model to quantify these abstract concepts. This led to the multi-layered analysis of ATR differentials and standard deviations. Second, to make this complex data intuitive and actionable. This drove the creation of the "Visual Universe," where abstract mathematical values are translated into geometric shapes, flows, and fields. The adaptive system was intentionally kept simple and transparent, focusing on a single, impactful parameter (time-based exits) to provide performance feedback without becoming an inscrutable "black box." The result is a tool that is both profoundly deep in its analysis and remarkably clear in its presentation.
⚠️ RISK DISCLAIMER AND BEST PRACTICES
VoVix+ is an advanced analytical tool, not a guarantee of future profits. All financial markets carry inherent risk. The backtesting results shown by the strategy are historical and do not guarantee future performance. This strategy incorporates realistic commission and slippage settings by default, but market conditions can vary. Always practice sound risk management, use position sizes appropriate for your account equity, and never risk more than you can afford to lose. It is recommended to use this strategy as part of a comprehensive trading plan. This was developed specifically for Futures
"The prevailing wisdom is that markets are always right. I take the opposite view. I assume that markets are always wrong. Even if my assumption is occasionally wrong, I use it as a working hypothesis."
— George Soros
— Dskyz, Trade with insight. Trade with anticipation.

Holy GrailThis is a long-only educational strategy that simulates what happens if you keep adding to a position during pullbacks and only exit when the asset hits a new All-Time High (ATH). It is intended for learning purposes only — not for live trading.
🧠 How it works:
The strategy identifies pullbacks using a simple moving average (MA).
When price dips below the MA, it begins monitoring for the first green candle (close > open).
That green candle signals a potential bottom, so it adds to the position.
If price goes lower, it waits for the next green candle and adds again.
The exit happens after ATH — it sells on each red candle (close < open) once a new ATH is reached.
You can adjust:
MA length (defines what’s considered a pullback)
Initial buy % (how much to pre-fill before signals start)
Buy % per signal (after pullback green candle)
Exit % per red candle after ATH
📊 Intended assets & timeframes:
This strategy is designed for broad market indices and long-term appreciating assets, such as:
SPY, NASDAQ, DAX, FTSE
Use it only on 1D or higher timeframes — it’s not meant for scalping or short-term trading.
⚠️ Important Limitations:
Long-only: The script does not short. It assumes the asset will eventually recover to a new ATH.
Not for all assets: It won't work on assets that may never recover (e.g., single stocks or speculative tokens).
Slow capital deployment: Entries happen gradually and may take a long time to close.
Not optimized for returns: Buy & hold can outperform this strategy.
No slippage, fees, or funding costs included.
This is not a performance strategy. It’s a teaching tool to show that:
High win rate ≠ high profitability
Patience can be deceiving
Many signals = long capital lock-in
🎓 Why it exists:
The purpose of this strategy is to demonstrate market psychology and risk overconfidence. Traders often chase strategies with high win rates without considering holding time, drawdowns, or opportunity cost.
This script helps visualize that phenomenon.

KST Strategy [Skyrexio]Overview
KST Strategy leverages Know Sure Thing (KST) indicator in conjunction with the Williams Alligator and Moving average to obtain the high probability setups. KST is used for for having the high probability to enter in the direction of a current trend when momentum is rising, Alligator is used as a short term trend filter, while Moving average approximates the long term trend and allows trades only in its direction. Also strategy has the additional optional filter on Choppiness Index which does not allow trades if market is choppy, above the user-specified threshold. Strategy has the user specified take profit and stop-loss numbers, but multiplied by Average True Range (ATR) value on the moment when trade is open. The strategy opens only long trades.
Unique Features
ATR based stop-loss and take profit. Instead of fixed take profit and stop-loss percentage strategy utilizes user chosen numbers multiplied by ATR for its calculation.
Configurable Trading Periods. Users can tailor the strategy to specific market windows, adapting to different market conditions.
Optional Choppiness Index filter. Strategy allows to choose if it will use the filter trades with Choppiness Index and set up its threshold.
Methodology
The strategy opens long trade when the following price met the conditions:
Close price is above the Alligator's jaw line
Close price is above the filtering Moving average
KST line of Know Sure Thing indicator shall cross over its signal line (details in justification of methodology)
If the Choppiness Index filter is enabled its value shall be less than user defined threshold
When the long trade is executed algorithm defines the stop-loss level as the low minus user defined number, multiplied by ATR at the trade open candle. Also it defines take profit with close price plus user defined number, multiplied by ATR at the trade open candle. While trade is in progress, if high price on any candle above the calculated take profit level or low price is below the calculated stop loss level, trade is closed.
Strategy settings
In the inputs window user can setup the following strategy settings:
ATR Stop Loss (by default = 1.5, number of ATRs to calculate stop-loss level)
ATR Take Profit (by default = 3.5, number of ATRs to calculate take profit level)
Filter MA Type (by default = Least Squares MA, type of moving average which is used for filter MA)
Filter MA Length (by default = 200, length for filter MA calculation)
Enable Choppiness Index Filter (by default = true, setting to choose the optional filtering using Choppiness index)
Choppiness Index Threshold (by default = 50, Choppiness Index threshold, its value shall be below it to allow trades execution)
Choppiness Index Length (by default = 14, length used in Choppiness index calculation)
KST ROC Length #1 (by default = 10, value used in KST indicator calculation, more information in Justification of Methodology)
KST ROC Length #2 (by default = 15, value used in KST indicator calculation, more information in Justification of Methodology)
KST ROC Length #3 (by default = 20, value used in KST indicator calculation, more information in Justification of Methodology)
KST ROC Length #4 (by default = 30, value used in KST indicator calculation, more information in Justification of Methodology)
KST SMA Length #1 (by default = 10, value used in KST indicator calculation, more information in Justification of Methodology)
KST SMA Length #2 (by default = 10, value used in KST indicator calculation, more information in Justification of Methodology)
KST SMA Length #3 (by default = 10, value used in KST indicator calculation, more information in Justification of Methodology)
KST SMA Length #4 (by default = 15, value used in KST indicator calculation, more information in Justification of Methodology)
KST Signal Line Length (by default = 10, value used in KST indicator calculation, more information in Justification of Methodology)
User can choose the optimal parameters during backtesting on certain price chart.
Justification of Methodology
Before understanding why this particular combination of indicator has been chosen let's briefly explain what is KST, Williams Alligator, Moving Average, ATR and Choppiness Index.
The KST (Know Sure Thing) is a momentum oscillator developed by Martin Pring. It combines multiple Rate of Change (ROC) values, smoothed over different timeframes, to identify trend direction and momentum strength. First of all, what is ROC? ROC (Rate of Change) is a momentum indicator that measures the percentage change in price between the current price and the price a set number of periods ago.
ROC = 100 * (Current Price - Price N Periods Ago) / Price N Periods Ago
In our case N is the KST ROC Length inputs from settings, here we will calculate 4 different ROCs to obtain KST value:
KST = ROC1_smooth × 1 + ROC2_smooth × 2 + ROC3_smooth × 3 + ROC4_smooth × 4
ROC1 = ROC(close, KST ROC Length #1), smoothed by KST SMA Length #1,
ROC2 = ROC(close, KST ROC Length #2), smoothed by KST SMA Length #2,
ROC3 = ROC(close, KST ROC Length #3), smoothed by KST SMA Length #3,
ROC4 = ROC(close, KST ROC Length #4), smoothed by KST SMA Length #4
Also for this indicator the signal line is calculated:
Signal = SMA(KST, KST Signal Line Length)
When the KST line rises, it indicates increasing momentum and suggests that an upward trend may be developing. Conversely, when the KST line declines, it reflects weakening momentum and a potential downward trend. A crossover of the KST line above its signal line is considered a buy signal, while a crossover below the signal line is viewed as a sell signal. If the KST stays above zero, it indicates overall bullish momentum; if it remains below zero, it points to bearish momentum. The KST indicator smooths momentum across multiple timeframes, helping to reduce noise and provide clearer signals for medium- to long-term trends.
Next, let’s discuss the short-term trend filter, which combines the Williams Alligator and Williams Fractals. Williams Alligator
Developed by Bill Williams, the Alligator is a technical indicator that identifies trends and potential market reversals. It consists of three smoothed moving averages:
Jaw (Blue Line): The slowest of the three, based on a 13-period smoothed moving average shifted 8 bars ahead.
Teeth (Red Line): The medium-speed line, derived from an 8-period smoothed moving average shifted 5 bars forward.
Lips (Green Line): The fastest line, calculated using a 5-period smoothed moving average shifted 3 bars forward.
When the lines diverge and align in order, the "Alligator" is "awake," signaling a strong trend. When the lines overlap or intertwine, the "Alligator" is "asleep," indicating a range-bound or sideways market. This indicator helps traders determine when to enter or avoid trades.
The next indicator is Moving Average. It has a lot of different types which can be chosen to filter trades and the Least Squares MA is used by default settings. Let's briefly explain what is it.
The Least Squares Moving Average (LSMA) — also known as Linear Regression Moving Average — is a trend-following indicator that uses the least squares method to fit a straight line to the price data over a given period, then plots the value of that line at the most recent point. It draws the best-fitting straight line through the past N prices (using linear regression), and then takes the endpoint of that line as the value of the moving average for that bar. The LSMA aims to reduce lag and highlight the current trend more accurately than traditional moving averages like SMA or EMA.
Key Features:
It reacts faster to price changes than most moving averages.
It is smoother and less noisy than short-term EMAs.
It can be used to identify trend direction, momentum, and potential reversal points.
ATR (Average True Range) is a volatility indicator that measures how much an asset typically moves during a given period. It was introduced by J. Welles Wilder and is widely used to assess market volatility, not direction.
To calculate it first of all we need to get True Range (TR), this is the greatest value among:
High - Low
abs(High - Previous Close)
abs(Low - Previous Close)
ATR = MA(TR, n) , where n is number of periods for moving average, in our case equals 14.
ATR shows how much an asset moves on average per candle/bar. A higher ATR means more volatility; a lower ATR means a calmer market.
The Choppiness Index is a technical indicator that quantifies whether the market is trending or choppy (sideways). It doesn't indicate trend direction — only the strength or weakness of a trend. Higher Choppiness Index usually approximates the sideways market, while its low value tells us that there is a high probability of a trend.
Choppiness Index = 100 × log10(ΣATR(n) / (MaxHigh(n) - MinLow(n))) / log10(n)
where:
ΣATR(n) = sum of the Average True Range over n periods
MaxHigh(n) = highest high over n periods
MinLow(n) = lowest low over n periods
log10 = base-10 logarithm
Now let's understand how these indicators work in conjunction and why they were chosen for this strategy. KST indicator approximates current momentum, when it is rising and KST line crosses over the signal line there is high probability that short term trend is reversing to the upside and strategy allows to take part in this potential move. Alligator's jaw (blue) line is used as an approximation of a short term trend, taking trades only above it we want to avoid trading against trend to increase probability that long trade is going to be winning.
Almost the same for Moving Average, but it approximates the long term trend, this is just the additional filter. If we trade in the direction of the long term trend we increase probability that higher risk to reward trade will hit the take profit. Choppiness index is the optional filter, but if it turned on it is used for approximating if now market is in sideways or in trend. On the range bounded market the potential moves are restricted. We want to decrease probability opening trades in such condition avoiding trades if this index is above threshold value.
When trade is open script sets the stop loss and take profit targets. ATR approximates the current volatility, so we can make a decision when to exit a trade based on current market condition, it can increase the probability that strategy will avoid the excessive stop loss hits, but anyway user can setup how many ATRs to use as a stop loss and take profit target. As was said in the Methodology stop loss level is obtained by subtracting number of ATRs from trade opening candle low, while take profit by adding to this candle's close.
Backtest Results
Operating window: Date range of backtests is 2023.01.01 - 2025.05.01. It is chosen to let the strategy to close all opened positions.
Commission and Slippage: Includes a standard Binance commission of 0.1% and accounts for possible slippage over 5 ticks.
Initial capital: 10000 USDT
Percent of capital used in every trade: 60%
Maximum Single Position Loss: -5.53%
Maximum Single Profit: +8.35%
Net Profit: +5175.20 USDT (+51.75%)
Total Trades: 120 (56.67% win rate)
Profit Factor: 1.747
Maximum Accumulated Loss: 1039.89 USDT (-9.1%)
Average Profit per Trade: 43.13 USDT (+0.6%)
Average Trade Duration: 27 hours
These results are obtained with realistic parameters representing trading conditions observed at major exchanges such as Binance and with realistic trading portfolio usage parameters.
How to Use
Add the script to favorites for easy access.
Apply to the desired timeframe and chart (optimal performance observed on 1h BTC/USDT).
Configure settings using the dropdown choice list in the built-in menu.
Set up alerts to automate strategy positions through web hook with the text: {{strategy.order.alert_message}}
Disclaimer:
Educational and informational tool reflecting Skyrexio commitment to informed trading. Past performance does not guarantee future results. Test strategies in a simulated environment before live implementation.

Three Candle Bullish Engulfing StrategyThe Three Candle Bullish Engulfing Strategy is a versatile, multi-mode trading system designed for TradingView, combining classic candlestick patterns with momentum confirmation and dynamic risk management. This script supports both swing trading and intraday approaches, as well as an optional RSI-based breakout mode for additional signal filtering.
Key Features:
Three Candle Pattern Detection:
The strategy identifies potential trend reversal points using a three-candle pattern:
The first candle is a strong bullish (or bearish) move.
The second candle is a doji or small-bodied candle, indicating indecision.
The third candle is a bullish (or bearish) engulfing candle that closes above (or below) the previous high (or low), confirming the reversal.
Flexible Trading Modes:
Swing Long Only: Enter long trades on bullish three-candle setups.
Intraday Long & Short: Trade both long and short based on bullish and bearish three-candle patterns, with automatic session-end exits.
RSI Breakout Mode: Enter long trades when the 1-hour RSI exceeds a user-defined threshold (default 80) and a bullish candle forms, with breakout confirmation and a fixed-percentage stop loss.
Visual Aids:
Plots the RSI breakout trigger price and stop loss on the chart for easy monitoring.
How It Works:
Three Candle Pattern Entries:
Long Entry: Triggered when a bullish candle is followed by a doji, then a bullish engulfing candle closes above the previous high.
Short Entry (Intraday only): Triggered by the inverse pattern—bearish candle, doji, then bearish engulfing candle closing below the previous low.
RSI Breakout Entries:
When the RSI on a higher timeframe (default 1 hour) exceeds the set threshold and a bullish candle forms, the script records a trigger price.
A long trade is entered if the price breaks above this trigger, with a stop loss set a fixed percentage below.
Exits:
Positions are closed if the trailing stop is hit, the session ends (for intraday mode), or the stop loss is triggered in RSI breakout mode.
In RSI breakout mode, positions are also closed if a new breakout trigger forms while in position.

Liquidity Grab Strategy (Volume Trap)🧠 Strategy Logic:
Liquidity Grab Detection:
The script looks for a sharp drop in price (bearish engulfing or breakdown candle).
However, volume remains flat (within 5% of the 20-period moving average), suggesting the move is manipulated, not genuine.
Fair Value Gap Confirmation (FVG):
It confirms that a Fair Value Gap exists — a gap between recent candle bodies that price is likely to retrace into.
This gap represents a high-probability entry zone.
Trade Setup:
A limit BUY order is placed at the base of the FVG.
Stop Loss (SL) is placed below the gap.
Take Profit (TP) is placed at the most recent swing high.
📈 How to Use It:
Add the strategy to your TradingView chart (1–5 min or 15 min works well for intraday setups).
Look for green BUY labels and plotted lines:
💚 Green = Entry price
🔴 Red = Stop loss
🔵 Blue = Take profit
The script will automatically simulate entries when conditions are met and exit either at TP or SL.
Use TradingView’s Strategy Tester to review:
Win rate
Net profit
Risk-adjusted performance

Triangle Breakout Strategy with TP/SL, EMA Filter📌 Triangle Breakout Strategy with TP/SL, EMA Filters, and Backtest – Explained.
✅ 1. Pattern Detection – Triangle Breakout
The script scans for triangle patterns by detecting local pivot highs and pivot lows.
It uses two recent highs and two recent lows to draw converging trendlines (upper and lower boundaries of the triangle).
If the price breaks above the upper trendline, a bullish breakout signal is generated.
🎯 2. TP (Take Profit) & SL (Stop Loss)
When a bullish breakout is detected:
A buy order is placed using strategy.entry.
TP and SL levels are calculated relative to the current close price:
TP = 3% above the entry price
SL = 1.5% below the entry price
These are defined using strategy.exit.
📊 3. EMA Filter
An optional filter checks if:
Price is above both EMA 20 and EMA 50
Only if this condition is met, the strategy allows a long entry.
You can toggle the filter on or off with useEMAFilter.
📈 4. Backtesting with Strategy Tester
This script uses strategy() instead of indicator() to enable TradingView’s built-in backtest engine.
Every buy entry and exit (based on TP or SL) is recorded.
📌 5. Visuals
EMA 20 and EMA 50 lines are plotted on the chart.
A label is shown when a breakout is detected: "Breakout Up"
Results (profit, win rate, drawdown, etc.) can be viewed in the Strategy Tester panel.

Arbitrage Spot-Futures Don++Strategy: Spot-Futures Arbitrage Don++
This strategy has been designed to detect and exploit arbitrage opportunities between the Spot and Futures markets of the same trading pair (e.g. BTC/USDT). The aim is to take advantage of price differences (spreads) between the two markets, while minimizing risk through dynamic position management.
[Operating principle
The strategy is based on calculating the spread between Spot and Futures prices. When this spread exceeds a certain threshold (positive or negative), reverse positions are opened simultaneously on both markets:
- i] Long Spot + Short Futures when the spread is positive.
- i] Short Spot + Long Futures when the spread is negative.
Positions are closed when the spread returns to a value close to zero or after a user-defined maximum duration.
[Strategy strengths
1. Adaptive thresholds :
- Entry/exit thresholds can be dynamic (based on moving averages and standard deviations) or fixed, offering greater flexibility to adapt to market conditions.
2. Robust data management :
- The script checks the validity of data before executing calculations, thus avoiding errors linked to missing or invalid data.
3. Risk limitation :
- A position size based on a percentage of available capital (default 10%) limits exposure.
- A time filter limits the maximum duration of positions to avoid losses due to persistent spreads.
4. Clear visualization :
- Charts include horizontal lines for entry/exit thresholds, as well as visual indicators for spread and Spot/Futures prices.
5. Alerts and logs :
- Alerts are triggered on entries and exits to inform the user in real time.
[Points for improvement or completion
Although this strategy is functional and robust, it still has a few limitations that could be addressed in future versions:
1. [Limited historical data :
- TradingView does not retrieve real-time data for multiple symbols simultaneously. This can limit the accuracy of calculations, especially under conditions of high volatility.
2. [Lack of liquidity management :
- The script does not take into account the volumes available on the order books. In conditions of low liquidity, it may be difficult to execute orders at the desired prices.
3. [Non-dynamic transaction costs :
- Transaction costs (exchange fees, slippage) are set manually. A dynamic integration of these costs via an external API would be more realistic.
4. User-dependency for symbols :
- Users must manually specify Spot and Futures symbols. Automatic symbol validation would be useful to avoid configuration errors.
5. Lack of advanced backtesting :
- Backtesting is based solely on historical data available on TradingView. An implementation with third-party data (via an API) would enable the strategy to be tested under more realistic conditions.
6. [Parameter optimization :
- Certain parameters (such as analysis period or spread thresholds) could be optimized for each specific trading pair.
[How can I contribute?
If you'd like to help improve this strategy, here are a few ideas:
1. Add additional filters:
- For example, a filter based on volume or volatility to avoid false signals.
2. Integrate dynamic costs:
- Use an external API to retrieve actual costs and adjust thresholds accordingly.
3. Improve position management:
- Implement hedging or scalping mechanisms to maximize profits.
4. Test on other pairs:
- Evaluate the strategy's performance on other assets (ETH, SOL, etc.) and adjust parameters accordingly.
5. Publish backtesting results :
- Share detailed analyses of the strategy's performance under different market conditions.
[Conclusion
This Spot-Futures arbitrage strategy is a powerful tool for exploiting price differentials between markets. Although it is already functional, it can still be improved to meet more complex trading scenarios. Feel free to test, modify and share your ideas to make this strategy even more effective!
[Thank you for contributing to this open-source community!
If you have any questions or suggestions, please feel free to comment or contact me directly.

PVSRA v5Overview of the PVSRA Strategy
This strategy is designed to detect and capitalize on volume-driven threshold breaches in price candles. It operates on the premise that when a high-volume candle breaks a critical price threshold, not all orders are filled within that candle’s range. This creates an imbalance—similar to a physical system being perturbed—causing the price to revert toward the level where the breach occurred to “absorb” the residual orders.
Key Features and Their Theoretical Underpinnings
Dynamic Volume Analysis and Threshold Detection
Volume Surges as Market Perturbations:
The script computes a moving average of volume over a short window and flags moments when the current volume significantly exceeds this average. These surges act as a perturbation—injecting “energy” into the market.
Adaptive Abnormal Volume Threshold:
By calculating a dynamic abnormal threshold using a daily volume average (via an 89-period VWMA) and standard deviation, the strategy identifies when the current volume is abnormally high. This mechanism mirrors the idea that when a system is disturbed (here, by a volume surge), it naturally seeks to return to equilibrium.
Candle Coloring and Visual Signal Identification
Differentiation of Candle Types:
The script distinguishes between bullish (green) and bearish (red) candles. It applies different colors based on the strength of the volume signal, providing a clear, visual representation of whether a candle is likely to trigger a price reversion.
Implication of Unfilled Orders:
A red (bearish) candle with high volume implies that sell pressure has pushed the price past a critical threshold—yet not all buy orders have been fulfilled. Conversely, a green (bullish) candle indicates that aggressive buying has left pending sell orders. In both cases, the market is expected to reverse toward the breach point to restore balance.
Trade Execution Logic: Normal and Reversal Trades
Normal Trades:
When a high-volume candle breaches a threshold and meets the directional conditions (e.g., a red candle paired with price above a daily upper band), the strategy enters a trade anticipating a reversion. The underlying idea is that the market will move back to the level where the threshold was crossed—clearing the residual orders in a manner analogous to a system following the path of least resistance.
Reversal Trades:
The strategy also monitors for clusters of consecutive signals within a short lookback period. When multiple signals accumulate, it interprets this as the market having overextended and, in a corrective move, reverses the typical trade direction. This inversion captures the market’s natural tendency to “correct” itself by moving in discrete, quantized steps—each step representing the absorption of a minimum quantum of order imbalance.
Risk and Trade Management
Stop Loss and Take Profit Buffers:
Both normal and reversal trades include predetermined buffers for stop loss and take profit levels. This systematic risk management approach is designed to capture the anticipated reversion while minimizing potential losses, aligning with the idea that market corrections follow the most energy-efficient path back to equilibrium.
Symbol Flexibility:
An option to override the chart’s symbol allows the strategy to be applied consistently across different markets, ensuring that the volume and price dynamics are analyzed uniformly.
Conceptual Bridge: From Market Dynamics to Trade Execution
At its core, the strategy treats market price movements much like a physical system that seeks to minimize “transactional energy” or inefficiency. When a price candle breaches a key threshold on high volume, it mimics an injection of energy into the system. The subsequent price reversion is the market’s natural response—moving in the most efficient path back to balance. This perspective is akin to the principle of least action, where the system evolves along the trajectory that minimizes cumulative imbalance, and it acknowledges that these corrections occur in discrete steps reflective of quantized order execution.
This unified framework allows the PVSRA strategy to not only identify when significant volume-based threshold breaches occur but also to systematically execute trades that benefit from the expected corrective moves.

GM+For a Short Trade:
When a bullish candle (close > open) is larger than the previous candle and the MACD histogram for the past three bars is consecutively lower (suggesting weakening upward momentum), the script enters a short position.
For a Long Trade:
When a bearish candle (close < open) is larger (in body size) than the previous candle and the MACD histogram for the past three bars is consecutively higher (suggesting the downward move is losing strength), the script enters a long position.
Position Management:
There are no stop loss or take profit levels. The position is closed only when an opposite signal appears.

ICT NY Kill Zone Auto Trading### **ICT NY Kill Zone Auto Trading Strategy (5-Min Chart)**
#### **Overview:**
This strategy is based on Inner Circle Trader (ICT) concepts, focusing on the **New York Kill Zone**. It is designed for trading GBP/USD exclusively on the **5-minute chart**, automatically entering and exiting trades during the US session.
#### **Key Components:**
1. **Time Filter**
- The strategy only operates during the **New York Kill Zone (9:30 AM - 11:00 AM NY Time)**.
- It ensures execution only on the **5-minute timeframe**.
2. **Fair Value Gaps (FVGs) Detection**
- The script identifies areas where price action left an imbalance, known as Fair Value Gaps (FVGs).
- These gaps indicate potential liquidity zones where price may return before continuing in the original direction.
3. **Order Blocks (OBs) Identification**
- **Bullish Order Block:** Occurs when price forms a strong bullish pattern, suggesting further upside movement.
- **Bearish Order Block:** Identified when a strong bearish formation signals potential downside continuation.
4. **Trade Execution**
- **Long Trade:** Entered when a bullish order block forms within the NY Kill Zone and aligns with an FVG.
- **Short Trade:** Entered when a bearish order block forms within the Kill Zone and aligns with an FVG.
5. **Risk Management**
- **Stop Loss:** Fixed at **30 pips** to limit downside risk.
- **Take Profit:** Set at **60 pips**, providing a **2:1 risk-reward ratio**.
6. **Visual Aids**
- The **Kill Zone is highlighted in blue** to help traders visually confirm the active session.
**Objective:**
This script aims to **capitalize on institutional price movements** within the New York session by leveraging ICT concepts such as FVGs and Order Blocks. By automating trade entries and exits, it eliminates emotions and ensures a disciplined trading approach.

Multi-Timeframe RSI Grid Strategy with ArrowsKey Features of the Strategy
Multi-Timeframe RSI Analysis:
The strategy calculates RSI values for three different timeframes:
The current chart's timeframe.
Two higher timeframes (configurable via higher_tf1 and higher_tf2 inputs).
It uses these RSI values to identify overbought (sell) and oversold (buy) conditions.
Grid Trading System:
The strategy uses a grid-based approach to scale into trades. It adds positions at predefined intervals (grid_space) based on the ATR (Average True Range) and a grid multiplication factor (grid_factor).
The grid system allows for pyramiding (adding to positions) up to a maximum number of grid levels (max_grid).
Daily Profit Target:
The strategy has a daily profit target (daily_target). Once the target is reached, it closes all open positions and stops trading for the day.
Drawdown Protection:
If the open drawdown exceeds 2% of the account equity, the strategy closes all positions to limit losses.
Reverse Signals:
If the RSI conditions reverse (e.g., from buy to sell or vice versa), the strategy closes all open positions and resets the grid.
Visualization:
The script plots buy and sell signals as arrows on the chart.
It also plots the RSI values for the current and higher timeframes, along with overbought and oversold levels.
How It Works
Inputs:
The user can configure parameters like RSI length, overbought/oversold levels, higher timeframes, grid spacing, lot size multiplier, maximum grid levels, daily profit target, and ATR length.
RSI Calculation:
The RSI is calculated for the current timeframe and the two higher timeframes using ta.rsi().
Grid System:
The grid system uses the ATR to determine the spacing between grid levels (grid_space).
When the price moves in the desired direction, the strategy adds positions at intervals of grid_space, increasing the lot size by a multiplier (lot_multiplier) for each new grid level.
Entry Conditions:
A buy signal is generated when the RSI is below the oversold level on all three timeframes.
A sell signal is generated when the RSI is above the overbought level on all three timeframes.
Position Management:
The strategy scales into positions using the grid system.
It closes all positions if the daily profit target is reached or if a reverse signal is detected.
Visualization:
Buy and sell signals are plotted as arrows on the chart.
RSI values for all timeframes are plotted, along with overbought and oversold levels.
Example Scenario
Suppose the current RSI is below 30 (oversold), and the RSI on the 60-minute and 240-minute charts is also below 30. This triggers a buy signal.
The strategy enters a long position with a base lot size.
If the price moves against the position by grid_space, the strategy adds another long position with a larger lot size (scaled by lot_multiplier).
This process continues until the maximum grid level (max_grid) is reached or the daily profit target is achieved.
Key Variables
grid_level: Tracks the current grid level (number of positions added).
last_entry_price: Tracks the price of the last entry.
base_size: The base lot size for the initial position.
daily_profit_target: The daily profit target in percentage terms.
target_reached: A flag to indicate whether the daily profit target has been achieved.
Potential Use Cases
This strategy is suitable for traders who want to combine RSI-based signals with a grid trading approach to capitalize on mean-reverting price movements.
It can be used in trending or ranging markets, depending on the RSI settings and grid parameters.
Limitations
The grid trading system can lead to significant drawdowns if the market moves strongly against the initial position.
The strategy relies heavily on RSI, which may produce false signals in strongly trending markets.
The daily profit target may limit potential gains in highly volatile markets.
Customization
You can adjust the input parameters (e.g., RSI length, overbought/oversold levels, grid spacing, lot multiplier) to suit your trading style and market conditions.
You can also modify the drawdown protection threshold or add additional filters (e.g., volume, moving averages) to improve the strategy's performance.
In summary, this script is a sophisticated trading strategy that combines RSI-based signals with a grid trading system to manage entries, exits, and position sizing. It includes features like daily profit targets, drawdown protection, and multi-timeframe analysis to enhance its robustnes

Multi-Band Comparison Strategy (CRYPTO)Multi-Band Comparison Strategy (CRYPTO)
Optimized for Cryptocurrency Trading
This Pine Script strategy is built from the ground up for traders who want to take advantage of cryptocurrency volatility using a confluence of advanced statistical bands. The strategy layers Bollinger Bands, Quantile Bands, and a unique Power-Law Band to map out crucial support/resistance zones. It then focuses on a Trigger Line—the lower standard deviation band of the upper quantile—to pinpoint precise entry and exit signals.
Key Features
Bollinger Band Overlay
The upper Bollinger Band visually shifts to yellow when price exceeds it, turning black otherwise. This offers a straightforward way to gauge heightened momentum or potential market slowdowns.
Quantile & Power-Law Integration
The script calculates upper and lower quantile bands to assess probabilistic price extremes.
A Power-Law Band is also available to measure historically significant return levels, providing further insight into overbought or oversold conditions in fast-moving crypto markets.
Standard Deviation Trigger
The lower standard deviation band of the upper quantile acts as the strategy’s trigger. If price consistently holds above this line, the strategy interprets it as a strong bullish signal (“green” zone). Conversely, dipping below indicates a “red” zone, signaling potential reversals or exits.
Consecutive Bar Confirmation
To reduce choppy signals, you can fine-tune the number of consecutive bars required to confirm an entry or exit. This helps filter out noise and false breaks—critical in the often-volatile crypto realm.
Adaptive for Multiple Timeframes
Whether you’re scalping on a 5-minute chart or swing trading on daily candles, the strategy’s flexible confirmation and overlay options cater to different market conditions and trading styles.
Complete Plot Customization
Easily toggle visibility of each band or line—Bollinger, Quantile, Power-Law, and more.
Built-in Simple and Exponential Moving Averages can be enabled to further contextualize market trends.
Why It Excels at Crypto
Cryptocurrencies are known for rapid price swings, and this strategy addresses exactly that by combining multiple statistical methods. The quantile-based confirmation reduces noise, while Bollinger and Power-Law bands help highlight breakout regions in trending markets. Traders have reported that it works seamlessly across various coins and tokens, adapting its triggers to each asset’s unique volatility profile.
Give it a try on your favorite cryptocurrency pairs. With advanced data handling, crisp visual cues, and adjustable confirmation logic, the Multi-Band Comparison Strategy provides a robust framework to capture profitable moves and mitigate risk in the ever-evolving crypto space.
Fibonacci Trend - Aynet1. Inputs
lookbackPeriod: Defines the number of bars to consider for calculating swing highs and lows. Default is 20.
fibLevel1 to fibLevel5: Fibonacci retracement levels to calculate price levels (23.6%, 38.2%, 50%, 61.8%, 78.6%).
useTime: Enables or disables time-based Fibonacci projections.
riskPercent: Defines the percentage of risk for trading purposes (currently not used in calculations).
2. Functions
isSwingHigh(index): Identifies a swing high at the given index, where the high of that candle is higher than both its previous and subsequent candles.
isSwingLow(index): Identifies a swing low at the given index, where the low of that candle is lower than both its previous and subsequent candles.
3. Variables
swingHigh and swingLow: Store the most recent swing high and swing low prices.
swingHighTime and swingLowTime: Store the timestamps of the swing high and swing low.
fib1 to fib5: Fibonacci levels based on the difference between swingHigh and swingLow.
4. Swing Point Detection
The script checks if the last bar is a swing high or swing low using the isSwingHigh() and isSwingLow() functions.
If a swing high is detected:
The high price is stored in swingHigh.
The timestamp of the swing high is stored in swingHighTime.
If a swing low is detected:
The low price is stored in swingLow.
The timestamp of the swing low is stored in swingLowTime.
5. Fibonacci Levels Calculation
If both swingHigh and swingLow are defined, the script calculates the Fibonacci retracement levels (fib1 to fib5) based on the price difference (priceDiff = swingHigh - swingLow).
6. Plotting Fibonacci Levels
Fibonacci levels (fib1 to fib5) are plotted as horizontal lines using the line.new() function.
Labels (e.g., "23.6%") are added near the lines to indicate the level.
Lines and labels are color-coded:
23.6% → Blue
38.2% → Green
50.0% → Yellow
61.8% → Orange
78.6% → Red
7. Filling Between Fibonacci Levels
The plot() function creates lines for each Fibonacci level.
The fill() function is used to fill the space between two levels with semi-transparent colors:
Blue → Between fib1 and fib2
Green → Between fib2 and fib3
Yellow → Between fib3 and fib4
Orange → Between fib4 and fib5
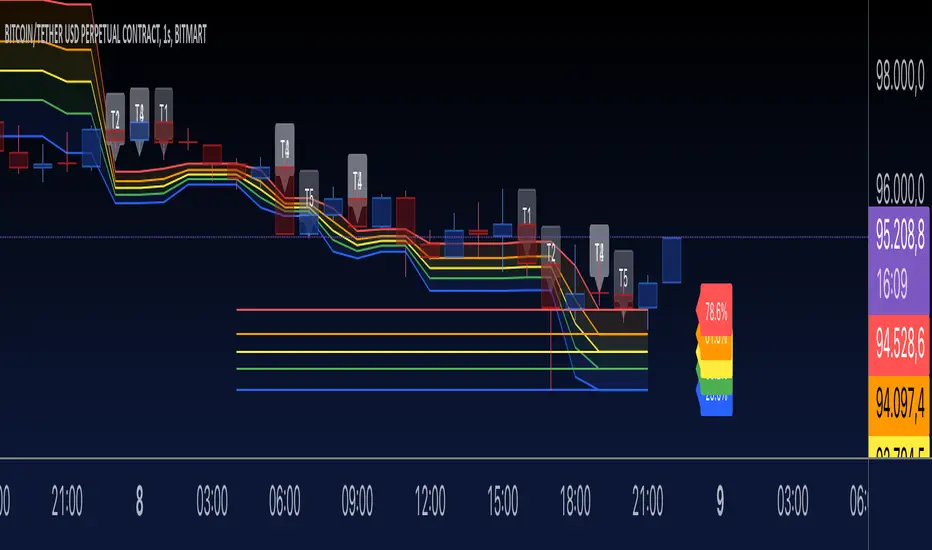
8. Time-Based Fibonacci Projections
If useTime is enabled:
The time difference (timeDiff) between the swing high and swing low is calculated.
Fibonacci time projections are added based on multiples of 23.6%.
If the current time reaches a projected time, a label (e.g., "T1", "T2") is displayed near the high price.
9. Trading Logic
Two placeholder variables are defined for trading logic:
longCondition: Tracks whether a condition for a long trade is met (currently not implemented).
shortCondition: Tracks whether a condition for a short trade is met (currently not implemented).
These variables can be extended to define entry/exit signals based on Fibonacci levels.
How It Works
Detect Swing Points: It identifies recent swing high and swing low points on the chart.
Calculate Fibonacci Levels: Based on the swing points, it computes retracement levels.
Visualize Levels: Plots the levels on the chart with labels and fills between them.
Time Projections: Optionally calculates time-based projections for future price movements.
Trading Opportunities: The framework provides tools for detecting potential reversal or breakout zones using Fibonacci levels.
Bullish Reversal Bar Strategy [Skyrexio]Overview
Bullish Reversal Bar Strategy leverages the combination of candlestick pattern Bullish Reversal Bar (description in Methodology and Justification of Methodology), Williams Alligator indicator and Williams Fractals to create the high probability setups. Candlestick pattern is used for the entering into trade, while the combination of Williams Alligator and Fractals is used for the trend approximation as close condition. Strategy uses only long trades.
Unique Features
No fixed stop-loss and take profit: Instead of fixed stop-loss level strategy utilizes technical condition obtained by Fractals and Alligator or the candlestick pattern invalidation to identify when current uptrend is likely to be over (more information in "Methodology" and "Justification of Methodology" paragraphs)
Configurable Trading Periods: Users can tailor the strategy to specific market windows, adapting to different market conditions.
Trend Trade Filter: strategy uses Alligator and Fractal combination as high probability trend filter.
Methodology
The strategy opens long trade when the following price met the conditions:
1.Current candle's high shall be below the Williams Alligator's lines (Jaw, Lips, Teeth)(all details in "Justification of Methodology" paragraph)
2.Price shall create the candlestick pattern "Bullish Reversal Bar". Optionally if MFI and AO filters are enabled current candle shall have the decreasing AO and at least one of three recent bars shall have the squat state on the MFI (all details in "Justification of Methodology" paragraph)
3.If price breaks through the high of the candle marked as the "Bullish Reversal Bar" the long trade is open at the price one tick above the candle's high
4.Initial stop loss is placed at the Bullish Reversal Bar's candle's low
5.If price hit the Bullish Reversal Bar's low before hitting the entry price potential trade is cancelled
6.If trade is active and initial stop loss has not been hit, trade is closed when the combination of Alligator and Williams Fractals shall consider current trend change from upward to downward.
Strategy settings
In the inputs window user can setup strategy setting:
Enable MFI (if true trades are filtered using Market Facilitation Index (MFI) condition all details in "Justification of Methodology" paragraph), by default = false)
Enable AO (if true trades are filtered using Awesome Oscillator (AO) condition all details in "Justification of Methodology" paragraph), by default = false)
Justification of Methodology
Let's explore the key concepts of this strategy and understand how they work together. The first and key concept is the Bullish Reversal Bar candlestick pattern. This is just the single bar pattern. The rules are simple:
Candle shall be closed in it's upper half
High of this candle shall be below all three Alligator's lines (Jaw, Lips, Teeth)
Next, let’s discuss the short-term trend filter, which combines the Williams Alligator and Williams Fractals. Williams Alligator
Developed by Bill Williams, the Alligator is a technical indicator that identifies trends and potential market reversals. It consists of three smoothed moving averages:
Jaw (Blue Line): The slowest of the three, based on a 13-period smoothed moving average shifted 8 bars ahead.
Teeth (Red Line): The medium-speed line, derived from an 8-period smoothed moving average shifted 5 bars forward.
Lips (Green Line): The fastest line, calculated using a 5-period smoothed moving average shifted 3 bars forward.
When the lines diverge and align in order, the "Alligator" is "awake," signaling a strong trend. When the lines overlap or intertwine, the "Alligator" is "asleep," indicating a range-bound or sideways market. This indicator helps traders determine when to enter or avoid trades.
Fractals, another tool by Bill Williams, help identify potential reversal points on a price chart. A fractal forms over at least five consecutive bars, with the middle bar showing either:
Up Fractal: Occurs when the middle bar has a higher high than the two preceding and two following bars, suggesting a potential downward reversal.
Down Fractal: Happens when the middle bar shows a lower low than the surrounding two bars, hinting at a possible upward reversal.
Traders often use fractals alongside other indicators to confirm trends or reversals, enhancing decision-making accuracy.
How do these tools work together in this strategy? Let’s consider an example of an uptrend.
When the price breaks above an up fractal, it signals a potential bullish trend. This occurs because the up fractal represents a shift in market behavior, where a temporary high was formed due to selling pressure. If the price revisits this level and breaks through, it suggests the market sentiment has turned bullish.
The breakout must occur above the Alligator’s teeth line to confirm the trend. A breakout below the teeth is considered invalid, and the downtrend might still persist. Conversely, in a downtrend, the same logic applies with down fractals.
How we can use all these indicators in this strategy? This strategy is a counter trend one. Candle's high shall be below all Alligator's lines. During this market stage the bullish reversal bar candlestick pattern shall be printed. This bar during the downtrend is a high probability setup for the potential reversal to the upside: bulls were able to close the price in the upper half of a candle. The breaking of its high is a high probability signal that trend change is confirmed and script opens long trade. If market continues going down and break down the bullish reversal bar's low potential trend change has been invalidated and strategy close long trade.
If market really reversed and started moving to the upside strategy waits for the trend change form the downtrend to the uptrend according to approximation of Alligator and Fractals combination. If this change happens strategy close the trade. This approach helps to stay in the long trade while the uptrend continuation is likely and close it if there is a high probability of the uptrend finish.
Optionally users can enable MFI and AO filters. First of all, let's briefly explain what are these two indicators. The Awesome Oscillator (AO), created by Bill Williams, is a momentum-based indicator that evaluates market momentum by comparing recent price activity to a broader historical context. It assists traders in identifying potential trend reversals and gauging trend strength.
AO = SMA5(Median Price) − SMA34(Median Price)
where:
Median Price = (High + Low) / 2
SMA5 = 5-period Simple Moving Average of the Median Price
SMA 34 = 34-period Simple Moving Average of the Median Price
This indicator is filtering signals in the following way: if current AO bar is decreasing this candle can be interpreted as a bullish reversal bar. This logic is applicable because initially this strategy is a trend reversal, it is searching for the high probability setup against the current trend. Decreasing AO is the additional high probability filter of a downtrend.
Let's briefly look what is MFI. The Market Facilitation Index (MFI) is a technical indicator that measures the price movement per unit of volume, helping traders gauge the efficiency of price movement in relation to trading volume. Here's how you can calculate it:
MFI = (High−Low)/Volume
MFI can be used in combination with volume, so we can divide 4 states. Bill Williams introduced these to help traders interpret the interaction between volume and price movement. Here’s a quick summary:
Green Window (Increased MFI & Increased Volume): Indicates strong momentum with both price and volume increasing. Often a sign of trend continuation, as both buying and selling interest are rising.
Fake Window (Increased MFI & Decreased Volume): Shows that price is moving but with lower volume, suggesting weak support for the trend. This can signal a potential end of the current trend.
Squat Window (Decreased MFI & Increased Volume): Shows high volume but little price movement, indicating a tug-of-war between buyers and sellers. This often precedes a breakout as the pressure builds.
Fade Window (Decreased MFI & Decreased Volume): Indicates a lack of interest from both buyers and sellers, leading to lower momentum. This typically happens in range-bound markets and may signal consolidation before a new move.
For our purposes we are interested in squat bars. This is the sign that volume cannot move the price easily. This type of bar increases the probability of trend reversal. In this indicator we added to enable the MFI filter of reversal bars. If potential reversal bar or two preceding bars have squat state this bar can be interpret as a reversal one.
Backtest Results
Operating window: Date range of backtests is 2023.01.01 - 2024.12.31. It is chosen to let the strategy to close all opened positions.
Commission and Slippage: Includes a standard Binance commission of 0.1% and accounts for possible slippage over 5 ticks.
Initial capital: 10000 USDT
Percent of capital used in every trade: 50%
Maximum Single Position Loss: -5.29%
Maximum Single Profit: +29.99%
Net Profit: +5472.66 USDT (+54.73%)
Total Trades: 103 (33.98% win rate)
Profit Factor: 1.634
Maximum Accumulated Loss: 1231.15 USDT (-8.32%)
Average Profit per Trade: 53.13 USDT (+0.94%)
Average Trade Duration: 76 hours
How to Use
Add the script to favorites for easy access.
Apply to the desired timeframe and chart (optimal performance observed on 4h ETH/USDT).
Configure settings using the dropdown choice list in the built-in menu.
Set up alerts to automate strategy positions through web hook with the text: {{strategy.order.alert_message}}
Disclaimer:
Educational and informational tool reflecting Skyrex commitment to informed trading. Past performance does not guarantee future results. Test strategies in a simulated environment before live implementation
These results are obtained with realistic parameters representing trading conditions observed at major exchanges such as Binance and with realistic trading portfolio usage parameters.

Adaptive Trend Flow Strategy with Filters for SPXThe Adaptive Trend Flow Strategy with Filters for SPX is a complete trading algorithm designed to identify traits and offer actionable alerts for the SPX index. This Pine Script approach leverages superior technical signs and user-described parameters to evolve to marketplace conditions and optimize performance.
Key Features and Functionality
Dynamic Trend Detection: Utilizes a dual EMA-based totally adaptive method for fashion calculation.
The script smooths volatility the usage of an EMA filter and adjusts sensitivity through the sensitivity enter. This allows for real-time adaptability to market fluctuations.
Trend Filters for Precision:
SMA Filter: A Simple Moving Average (SMA) guarantees that trades are achieved best while the rate aligns with the shifting average trend, minimizing false indicators.
MACD Filter: The Moving Average Convergence Divergence (MACD) adds some other layer of confirmation with the aid of requiring alignment among the MACD line and its sign line.
Signal Generation:
Long Signals: Triggered when the fashion transitions from bearish to bullish, with all filters confirming the pass.
Short Signals: Triggered while the trend shifts from bullish to bearish, imparting opportunities for final positions.
User Customization:
Adjustable parameters for EMAs, smoothing duration, and sensitivity make certain the strategy can adapt to numerous buying and selling patterns.
Enable or disable filters (SMA or MACD) based totally on particular market conditions or consumer possibilities.
Leverage and Position Sizing: Incorporates a leverage aspect for dynamic position sizing.
Automatically calculates the exchange length based on account fairness and the leverage element, making sure hazard control is in area.
Visual Enhancements: Plots adaptive fashion ranges (foundation, top, decrease) for actual-time insights into marketplace conditions.
Color-coded bars and heritage to visually represent bullish or bearish developments.
Custom labels indicating crossover and crossunder occasions for clean sign visualization.
Alerts and Automation: Configurable alerts for each lengthy and quick indicators, well matched with automated buying and selling structures like plugpine.Com.
JSON-based alert messages consist of account credentials, motion type, and calculated position length for seamless integration.
Backtesting and Realistic Assumptions: Includes practical slippage, commissions, and preliminary capital settings for backtesting accuracy.
Leverages excessive-frequency trade sampling to make certain strong strategy assessment.
How It Works
Trend Calculation: The method derives a principal trend basis with the aid of combining fast and gradual EMAs. It then uses marketplace volatility to calculate adaptive upper and decrease obstacles, creating a dynamic channel.
Filter Integration: SMA and MACD filters work in tandem with the fashion calculation to ensure that handiest excessive-probability signals are accomplished.
Signal Execution: Signals are generated whilst the charge breaches those dynamic tiers and aligns with the fashion and filters, ensuring sturdy change access situations.
How to Use
Setup: Apply the approach to SPX or other well suited indices.
Adjust person inputs, together with ATR length, EMA smoothing, and sensitivity, to align together with your buying and selling possibilities.
Enable or disable the SMA and MACD filters to test unique setups.
Alerts: Configure signals for computerized notifications or direct buying and selling execution through third-celebration systems.
Use the supplied JSON payload to integrate with broking APIs or automation tools.
Optimization:
Experiment with leverage, filter out settings, and sensitivity to find most effective configurations to your hazard tolerance and marketplace situations.
Considerations and Best Practices
Risk Management: Always backtest the method with realistic parameters, together with conservative leverage and commissions.
Market Suitability: While designed for SPX, this method can adapt to other gadgets by means of adjusting key parameters.
Limitations: The method is trend-following and can underperform in enormously risky or ranging markets. Regularly evaluate and modify parameters primarily based on recent market conduct.
If you have any questions please let me know - I'm here to help!

Fibonacci Retracement Strategy for CryptoThe Enhanced Fibonacci Retracement Strategy is designed to help traders capitalize on key Fibonacci levels for both long and short trades. This script automatically identifies significant swing highs and lows within a customizable lookback period and dynamically plots Fibonacci retracement levels (0%, 23.6%, 38.2%, 50%, 61.8%, 78.6%, and 100%) as support and resistance levels.
Key Features:
Automatic Fibonacci Levels:
The script identifies the highest high and lowest low over a user-defined lookback period to calculate Fibonacci retracement levels.
Dual-Directional Trading:
Long Trades: Triggered when the price crosses above the 61.8% retracement level, anticipating a reversal.
Short Trades: Triggered when the price crosses below the 38.2% retracement level, capturing potential downward movement.
Compact Line Option:
Users can toggle "Compact Fibonacci Lines" to reduce visual clutter on the chart, making the lines shorter and easier to interpret.
Dynamic Alerts:
Alerts are embedded directly into the strategy logic for entry and exit points.
Long Entry: Triggered when the price bounces above the 61.8% level.
Long Exit: Triggered when the price reaches the 23.6% level.
Short Entry: Triggered when the price crosses below the 38.2% level.
Short Exit: Triggered when the price reaches the 78.6% level.
Clear Visualization:
Fibonacci levels are plotted with distinct colors and dashed lines (optional compact view),
providing traders with clear and actionable levels to make decisions.
Inputs:
Lookback Period: Number of candles to calculate swing highs and lows.
Plot Fibonacci Levels: Toggle to enable/disable plotting levels.
Compact Fibonacci Lines: Reduce the length of Fibonacci lines for a cleaner chart.
How It Works:
The strategy identifies a high-low range within the lookback period.
Fibonacci levels are calculated based on the range and plotted on the chart.
Long Trade Example:
Enter when the price crosses above the 61.8% level.
Exit when the price reaches the 23.6% level.
Short Trade Example:
Enter when the price crosses below the 38.2% level.
Exit when the price reaches the 78.6% level.
Best Use Cases:
Trending Markets: Use retracements to time entries in the direction of the trend.
Range-Bound Markets: Identify and trade reversals near key Fibonacci levels.
Important Notes:
This strategy is not financial advice and should be backtested thoroughly before live trading.
Risk management is crucial! Consider using stop-loss orders for protection.
Customize inputs to suit your preferred timeframe and trading style.

VIX Spike StrategyThis script implements a trading strategy based on the Volatility Index (VIX) and its standard deviation. It aims to enter a long position when the VIX exceeds a certain number of standard deviations above its moving average, which is a signal of a volatility spike. The position is then exited after a set number of periods.
VIX Symbol (vix_symbol): The input allows the user to specify the symbol for the VIX index (typically "CBOE:VIX").
Standard Deviation Length (stddev_length): The number of periods used to calculate the standard deviation of the VIX. This can be adjusted by the user.
Standard Deviation Multiplier (stddev_multiple): This multiplier is used to determine how many standard deviations above the moving average the VIX must exceed to trigger a long entry.
Exit Periods (exit_periods): The user specifies how many periods after entering the position the strategy will exit the trade.
Strategy Logic:
Data Loading: The script loads the VIX data, both for the current timeframe and as a rescaled version for calculation purposes.
Standard Deviation Calculation: It calculates both the moving average (SMA) and the standard deviation of the VIX over the specified period (stddev_length).
Entry Condition: A long position is entered when the VIX exceeds the moving average by a specified multiple of its standard deviation (calculated as vix_mean + stddev_multiple * vix_stddev).
Exit Condition: After the position is entered, it will be closed after the user-defined number of periods (exit_periods).
Visualization:
The VIX is plotted in blue.
The moving average of the VIX is plotted in orange.
The threshold for the VIX, which is the moving average plus the standard deviation multiplier, is plotted in red.
The background turns green when the entry condition is met, providing a visual cue.
Sources:
The VIX is often used as a measure of market volatility, with high values indicating increased uncertainty in the market.
Standard deviation is a statistical measure of the variability or dispersion of a set of data points. In financial markets, it is used to measure the volatility of asset prices.
References:
Bollerslev, T. (1986). "Generalized Autoregressive Conditional Heteroskedasticity." Journal of Econometrics.
Black, F., & Scholes, M. (1973). "The Pricing of Options and Corporate Liabilities." Journal of Political Economy.
R-based Strategy Template [Daveatt]Have you ever wondered how to properly track your trading performance based on risk rather than just profits?
This template solves that problem by implementing R-multiple tracking directly in TradingView's strategy tester.
This script is a tool that you must update with your own trading entry logic.
Quick notes
Before we dive in, I want to be clear: this is a template focused on R-multiple calculation and visualization.
I'm using a basic RSI strategy with dummy values just to demonstrate how the R tracking works. The actual trading signals aren't important here - you should replace them with your own strategy logic.
R multiple logic
Let's talk about what R-multiple means in practice.
Think of R as your initial risk per trade.
For instance, if you have a $10,000 account and you're risking 1% per trade, your 1R would be $100.
A trade that makes twice your risk would be +2R ($200), while hitting your stop loss would be -1R (-$100).
This way of measuring makes it much easier to evaluate your strategy's performance regardless of account size.
Whenever the SL is hit, we lose -1R
Proof showing the strategy tester whenever the SL is hit: i.imgur.com
The magic happens in how we calculate position sizes.
The script automatically determines the right position size to risk exactly your specified percentage on each trade.
This is done through a simple but powerful calculation:
risk_amount = (strategy.equity * (risk_per_trade_percent / 100))
sl_distance = math.abs(entry_price - sl_price)
position_size = risk_amount / (sl_distance * syminfo.pointvalue)
Limitations with lower timeframe gaps
This ensures that if your stop loss gets hit, you'll lose exactly the amount you intended to risk. No more, no less.
Well, could be more or less actually ... let's assume you're trading futures on a 15-minute chart but in the 1-minute chart there is a gap ... then your 15 minute SL won't get filled and you'll likely to not lose exactly -1R
This is annoying but it can't be fixed - and that's how trading works anyway.
Features
The template gives you flexibility in how you set your stop losses. You can use fixed points, ATR-based stops, percentage-based stops, or even tick-based stops.
Regardless of which method you choose, the position sizing will automatically adjust to maintain your desired risk per trade.
To help you track performance, I've added a comprehensive statistics table in the top right corner of your chart.
It shows you everything you need to know about your strategy's performance in terms of R-multiples: how many R you've won or lost, your win rate, average R per trade, and even your longest winning and losing streaks.
Happy trading!
And remember, measuring your performance in R-multiples is one of the most classical ways to evaluate and improve your trading strategies.
Daveatt
